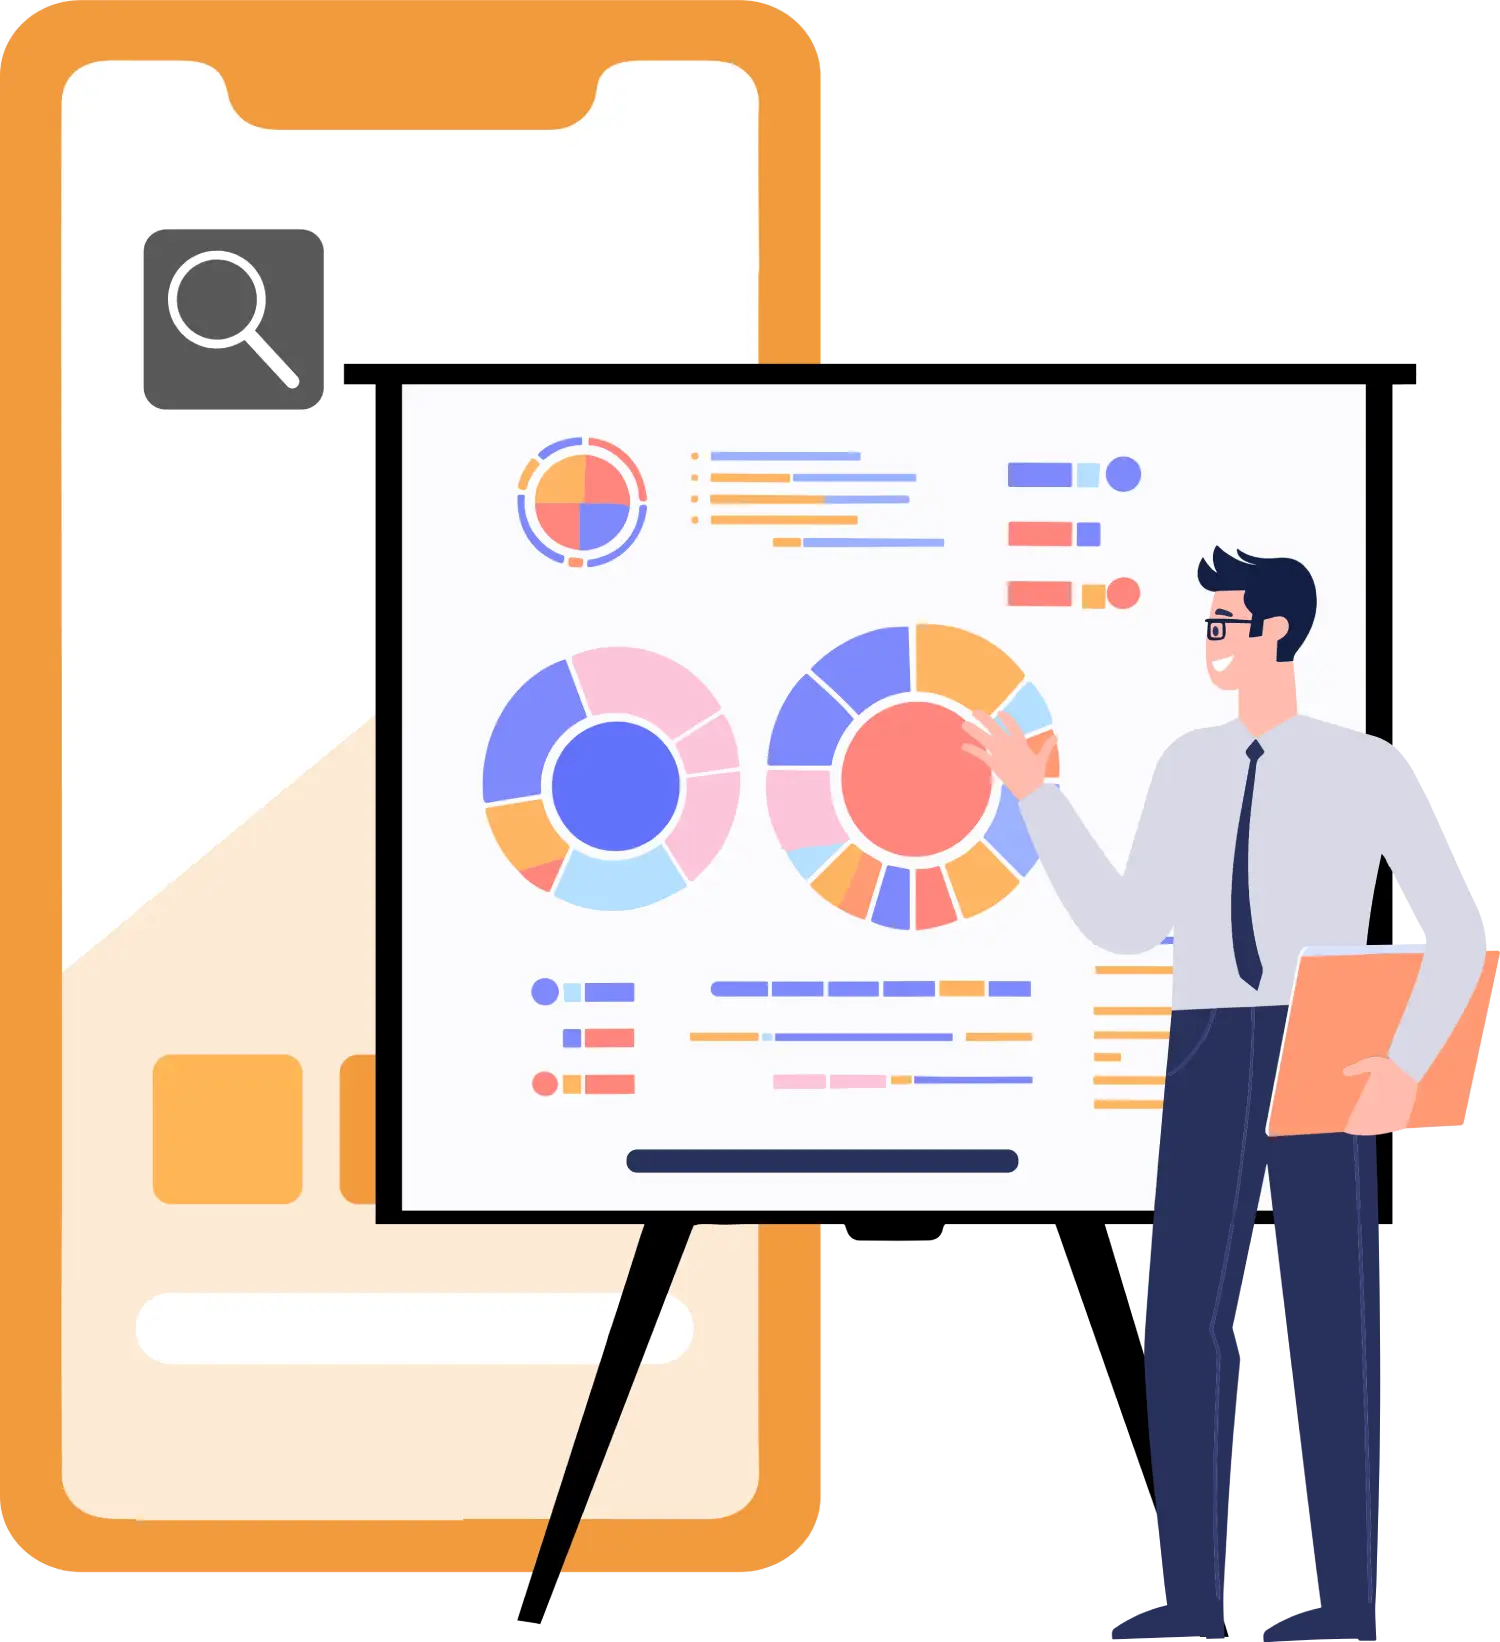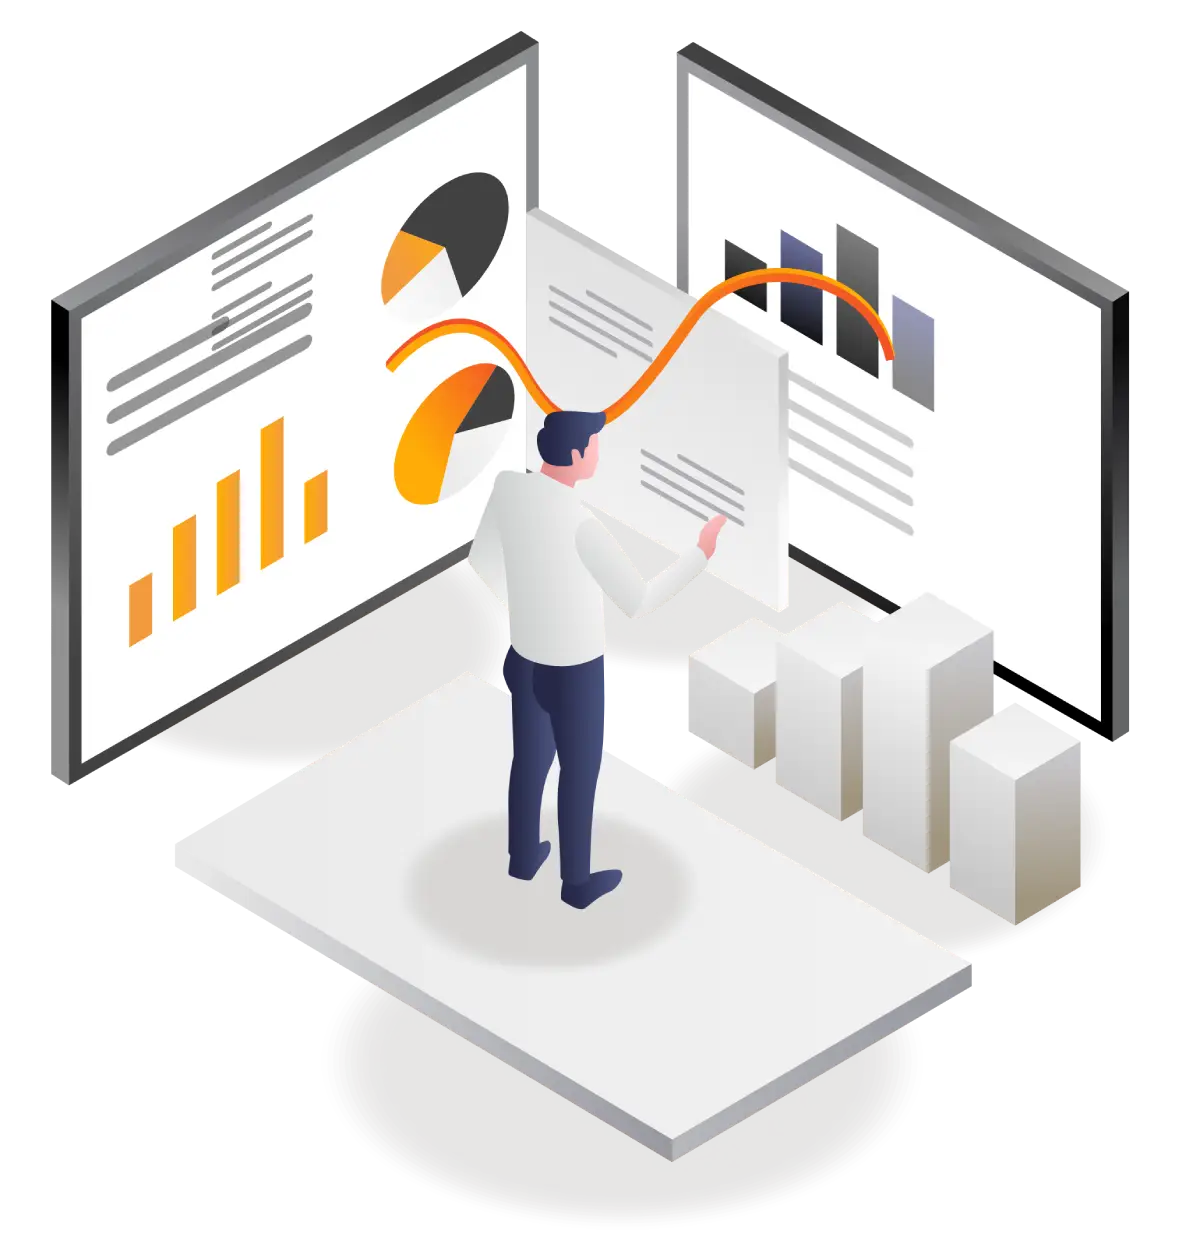
Unlock Insights, Empower Decisions: Introducing Data Visualization Solutions
We specialize in translating your business data into actionable insights, empowering informed decision-making. As a premier data visualization company, we offer solutions that leverage visual elements like charts and graphs to illuminate your data for strategic business intelligence, shaping your next moves with precision.
Our services keep you informed about your business trends, patterns, and recent activities by seamlessly extracting data from multiple sources. We present information in a format tailored to the data type, facilitating the identification of customer behavioral shifts, reasons behind them, and predictive analysis for future trends.
Visualize, Empower, Succeed: Data Visualization Services
Data Platform Development
Our team of data visualization development experts specializes in crafting bespoke platforms for comprehensive data management. From gathering and cleaning raw data across diverse sources to centralizing and transforming data storage, sharing, and analysis, we offer end-to-end solutions. Our services include building robust data management platforms and efficient business intelligence through data warehouses tailored to your needs.
Integration of Data Sources: We specialize in integrating data sources to create unified sets of information suitable for both operational and analytical purposes.
Engineer ELT/ETL: Our expertise lies in engineering ELT/ETL and OLAP processes to seamlessly integrate data from various sources and conduct a thorough analysis.
Data Storage & Security: We specialize in data storage and security solutions aimed at minimizing risks and guaranteeing the authenticity of your data.
Reports and Dashboards Development
We specialize in crafting custom dashboards that cater to your unique business requirements. These dashboards offer a clear and concise view of essential metrics and key performance indicators (KPIs). Our solutions are fully customizable, ensuring intuitive and interactive experiences for users. You can effortlessly track multiple KPIs from various data sources and gain easy-to-understand insights for quick decision-making. Empower your team with real-time, interactive dashboards that provide actionable insights at a glance. By monitoring key metrics and performance indicators in one intuitive and user-friendly interface, you can stay ahead of the competition.
Operational Dashboards: We specialize in developing operational dashboards designed to monitor business processes and pinpoint bottlenecks across interconnected Key Performance Indicators (KPIs).
Analytical Dashboards: Our analytical dashboards are designed to identify trends and construct forecasts utilizing historical data as a foundation.
Strategic Dashboards: We craft strategic dashboards that enable the monitoring of Key Performance Indicators (KPIs) throughout the organization in alignment with the desired strategy.
Dashboard Optimization
Our BI experts excel in fine-tuning dashboards at the data source, data environment, and data model levels to surpass your expectations. Whether analyzing and improving existing dashboards or enhancing performance, we focus on optimizing database queries, refining visual parameters, and facilitating improved access. Count on our team to support you in delivering crucial insights seamlessly across both mobile and web interfaces, all while significantly reducing load times.
Desktop & Mobile View Configuration: Configuration for Desktop and Mobile Views to streamline access to dashboards and reports, ensuring ease of use across devices.
Report Scheduling & Automation: Automated Report Scheduling to extract and deliver relevant data to stakeholders periodically, streamlining communication and ensuring timely access to crucial information.
Report Customization: Customizing reports utilizing platforms such as Power BI, Tableau, and similar tools to meet specific business requirements and enhance data visualization.
Technical Upgrades & Configurations: Enhancing system quality, features, and security through technical upgrades and configurations.
Data Visualization with Cloud Services
Our team harnesses the power of AWS and Azure cloud platforms, leveraging key services like Azure Data Explorer and Amazon QuickSight. We specialize in integrating data from multiple cloud sources, including big data, third-party, and B2B, onto consolidated dashboards for streamlined analysis and accessibility.
Data Visualization with Amazon QuickSight: Utilizing Amazon QuickSight for data visualization enables the interpretation of data through natural language.
Data Visualization with Azure Data Explorer: Leveraging Azure Data Explorer for data visualization facilitates the analysis of large volumes of data in near real-time.
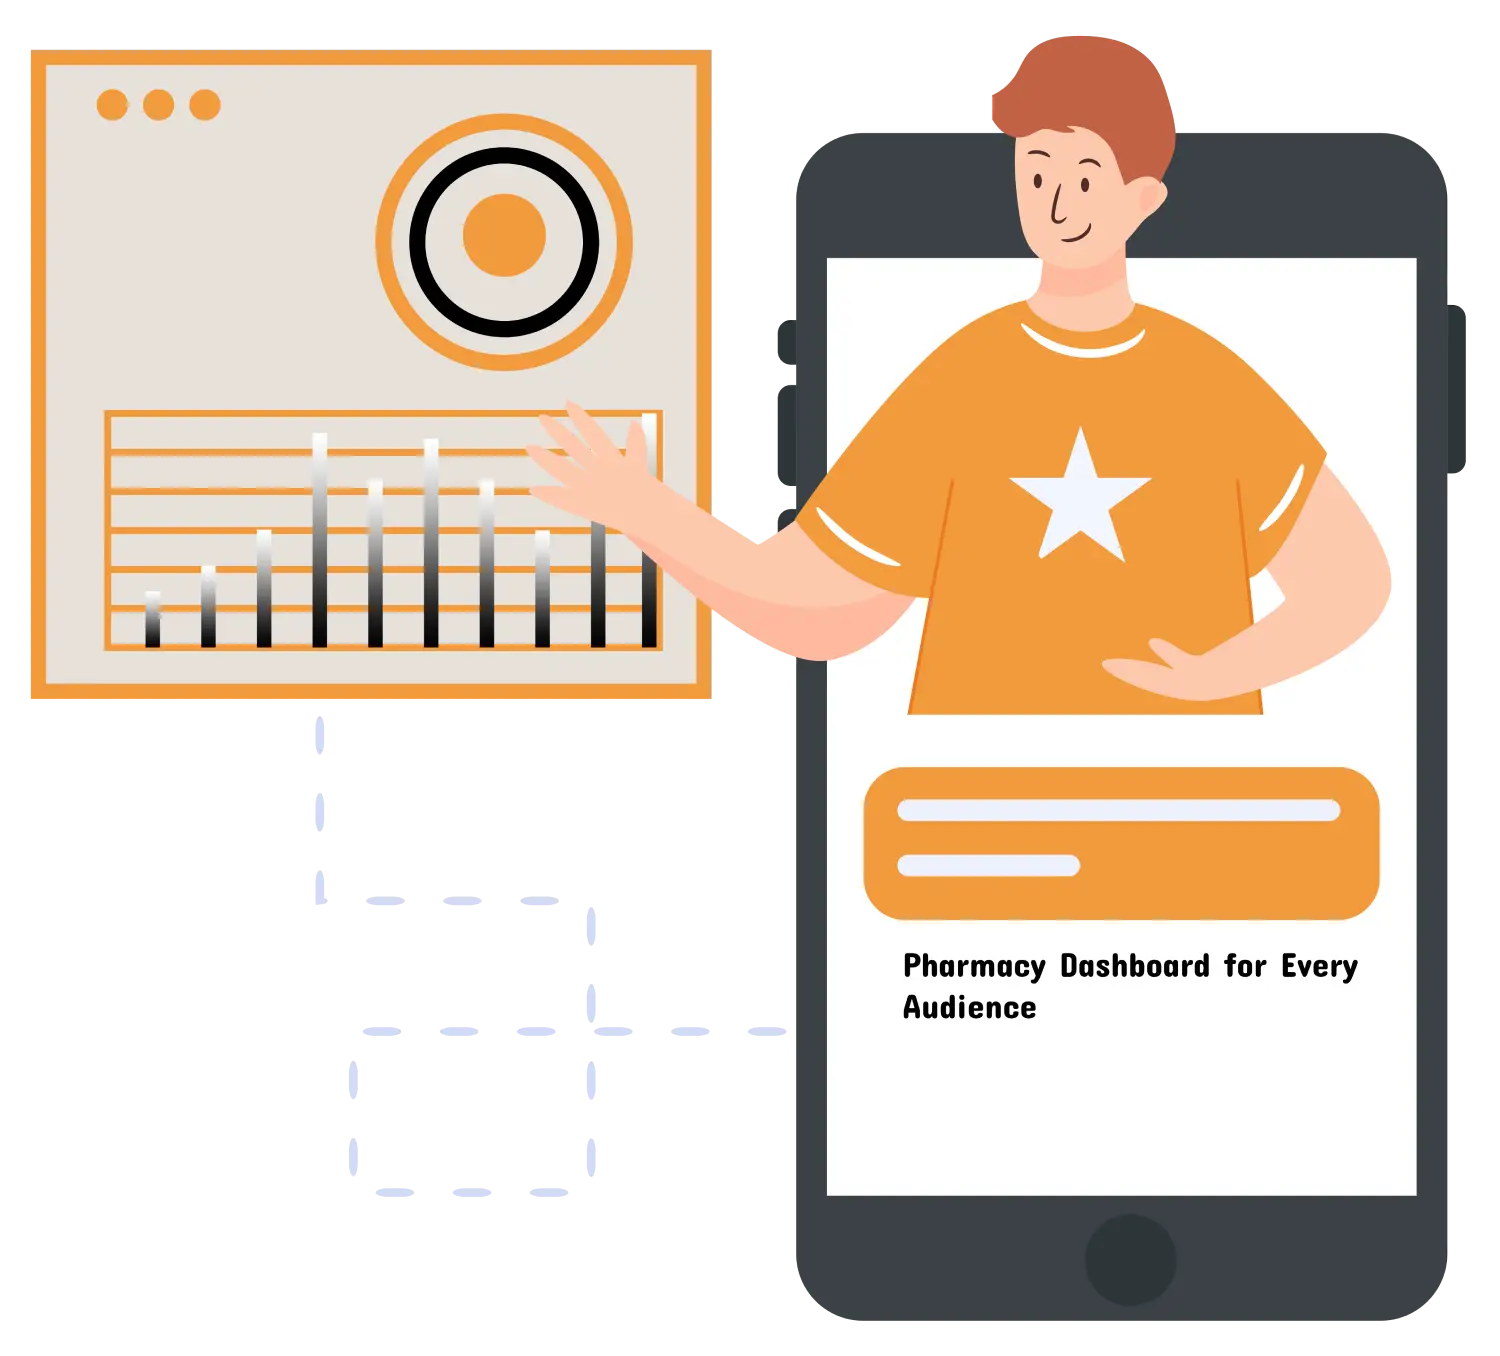
Unveiling Insights, Shaping Decisions: Our Data Visualization Solutions
Tableau's data visualization converts complex data into intuitive visuals like charts and maps, enabling quicker and easier data comprehension.
Discover, Decode, Decide: The Power of Data Visualization
Transforming Frontiers, Shaping Tomorrow: Our Industry Solutions
Real Estate
E-commerce
Education
Healthcare
Retail
Logistics
Travel and Hospitality
Finance
Empowering Innovation, Building Futures: Our Technology Stack
Frequently Asked Questions
The possibilities are endless! Traditional visualizations and the impact of text often go overlooked. However, common categorizations include charts, tables, graphs, maps, infographics, and dashboards.
Analyzing large datasets can be challenging, and not everyone is expected to grasp it as data analysts do. Data visualization simplifies the presentation of analysis outcomes for everyone to understand. Clearly visualizing data can expedite processes in your corporate environment.
Data visualization involves presenting data through charts, graphs, and diagrams to convey complex and challenging information in a meaningful way. It helps businesses, governments, and individuals better understand data.
The popularity of data visualization is attributed to several benefits, including:
- The human brain can process visualized data more quickly and effectively.
- Charts and graphs are easier to comprehend than spreadsheets.
- Data visualization tools uncover insights that traditional reports may overlook.
- It provides actionable insights that help identify areas for improvement.
- Organizations using data visualization often experience increased revenue through enhanced productivity and sales.
Dashboards offer convenient and swift access to the information you aim to interpret. Tailored to your requirements, here are some ways they can be beneficial:
- Custom dashboards help establish KPIs and monitor essential information.
- They consolidate diverse data types to provide insights and critical metrics.
- Real-time detection of positive and negative changes enables prompt adjustments in business strategies.
- Dashboards integrated with predictive analytics facilitate improved sales forecasts and strategic decision-making to achieve your objectives.
As a seasoned data visualization company, we support you throughout your data journey, offering technology consulting and goal-oriented support. Our skilled data scientists collaborate closely with you to foster a data-driven culture, providing stakeholders access to essential information and key insights for better decision-making. Our approach encompasses:
Data Collection: Gathering accurate data from diverse sources that reflect your business’s true strength.
Data Cleaning: Ensuring data accuracy by eliminating erroneous values or outliers.
Data Modeling: Employing data mapping techniques to select appropriate chart or graph types based on highlighted insights.
Data Preparation: Transforming data structure by defining data columns, groups, and aggregate values as required for visualizations.
Data Visualization: Developing IT solutions tailored to your needs by applying our visualization expertise to prepared data.
Yes, we provide migration services from Tableau to Power BI, facilitating the transition of your data and dashboards between platforms. Our team of experts is dedicated to ensuring a seamless and efficient migration experience for you.
Data visualization enables the identification of trends and patterns within your data that may not be readily apparent in a spreadsheet or report. This empowers you to make informed decisions grounded in concrete data, rather than relying on guesswork or intuition.
