
Data Analytics, BI & Decision Intelligence Services
Your teams aren't short on reports. They're short on numbers everyone trusts. Our business intelligence services bring scattered spreadsheets and conflicting dashboards into one consistent view, with KPIs your departments agree on and reporting your leaders can act on without double-checking it first. Where the business case calls for it, we extend that foundation into decision intelligence services, connecting the data to the decision it's meant to inform.
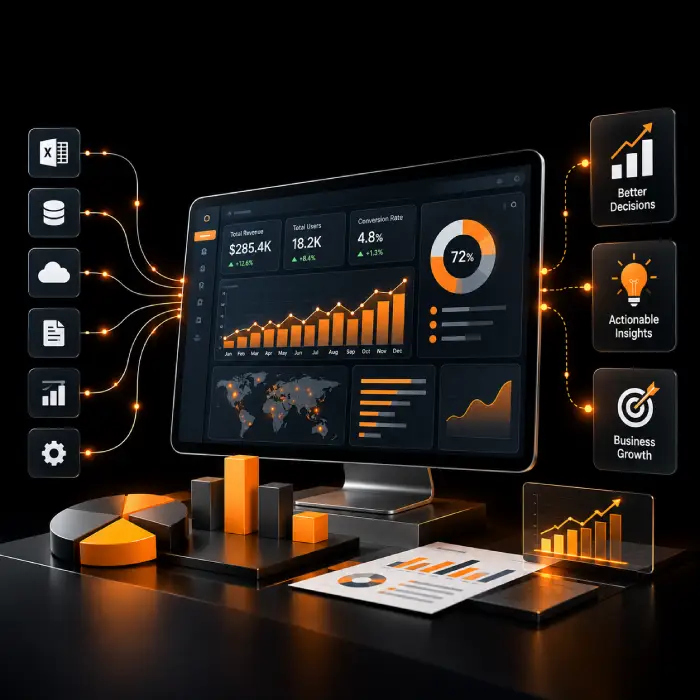
What Do Data Analytics, BI & Decision Intelligence Services Include?
These three disciplines are related, but they are not the same thing, and treating them as interchangeable is part of why many BI programs stall. Data analytics is the work of examining data to find trends, relationships, and performance patterns. Business intelligence organizes that analysis into consistent reports, dashboards, and KPIs that everyone in the business reads the same way. Decision intelligence goes one step further, connecting a dashboard's numbers to the business context, the decision in front of a stakeholder, and what happens after that decision is made. Most engagements begin as a focused business intelligence consulting conversation, part of our broader analytics consulting services, mapping which metrics matter and who owns them before any dashboard work starts. The result is one of our Data Analytics Solutions, scoped to what your business actually needs rather than a fixed package.
A typical engagement covers:
- Defining the business metrics and KPIs that matter, with one agreed definition per metric across departments.
- Building an analytics data model that reflects how your business actually asks questions, not just how source systems store data.
- Designing interactive dashboards and automated reports for executive, operational, and self-service use.
- Supporting decision workflows with scenario analysis and context, where the business case justifies it.
Why Businesses Invest in Data Analytics, BI & Decision Intelligence
Most of these problems aren't visible as a single incident. They show up as a slow erosion of trust in the numbers people are asked to act on.
Disconnected Reports, Conflicting Numbers
Finance, sales, and operations each keep their own version of the same metric, often from a spreadsheet one person updates by hand, so meetings spend time reconciling figures instead of discussing them. This is the gap business intelligence services are built to close.
Limited Executive Visibility
Leaders often see performance a week or a month after it happened, by which point the decision it should have informed has already been made another way.
Dashboards Nobody Adopts
A dashboard built around what was easy to pull from the database, rather than the question a stakeholder actually asks, gets opened once and then ignored. Self-service BI only works if the underlying model matches how people think.
Slow, Reactive Decisions
Without standardized KPI dashboards, operational teams notice a problem only after it has already affected the quarter's numbers, rather than while there's still time to correct course.
Difficulty Seeing Trends and Gaps
Raw numbers without the right data model behind them rarely reveal why performance moved. Business performance analytics built on a proper semantic layer is what turns a number into an explanation.
Data Analytics, BI & Decision Intelligence Solutions Built for Your Business
You don't need every capability below for every engagement. Most Business Intelligence Solutions start with one or two of these and expand as the reporting foundation proves itself.
Business Intelligence & Reporting
We consolidate reporting into a single, governed source, so leadership and finance stop reconciling different numbers for the same metric and start working from one set everyone trusts.
Interactive Dashboard Development
We build drill-down dashboards that let teams explore performance instead of just reading a static report, so the detail behind every number is a click away. Full dashboard development services depth lives on our Data Visualization Services page.
KPI & Performance Analytics
We standardize how every KPI is defined and tracked, replacing the five competing versions each department calculates on its own with one scorecard everyone reads the same way.
Executive & Operational Dashboards
Executive dashboards give leadership a strategic, company-wide view, while operational dashboards track day-to-day performance for frontline managers, both built on the same underlying metrics so the numbers never conflict.
Analytics Data Modeling
Our data modeling for BI work designs the semantic layer between raw source data and every dashboard built on top of it, so metrics behave consistently no matter who builds the next report, instead of breaking each time one is added.
Self-Service BI
We give business teams governed access to a curated data model they can explore on their own, so they're no longer waiting on IT or analytics for every new report, without losing control of definitions or security.
Reporting Automation
Reporting automation refreshes data and distributes reports on a schedule, so teams who were rebuilding the same report by hand every week get those hours of manual prep work back each month.
Decision Intelligence & Decision Support
We provide business decision support that connects dashboard metrics to business context and available options, helping stakeholders make faster, better-informed decisions.
Scenario and What-If Analysis
For planning decisions where the cost of guessing wrong is high, such as pricing, staffing, or inventory changes, we model how a proposed change would likely move your key metrics before you commit to it. We add this where the business case supports it, not as a default on every engagement.
Make Your Business Data More Actionable
If your teams are reconciling numbers instead of acting on them, that's a reporting and metric-definition problem we can help you fix, not a sign you need a bigger data platform. The goal is data-driven decision-making your teams actually trust.
Our Data Analytics and BI Process
A practical, question-first approach, since a dashboard built before the business question is agreed rarely gets adopted.
- 1
Business Questions & KPI Discovery
We start with the decisions your stakeholders need to make and the KPIs those decisions depend on, not with the tables already sitting in your warehouse.
- 2
Data Source & Reporting Assessment
We review your current reports, spreadsheets, and systems to see where metrics already conflict and where the underlying data can actually support what being asked of it.
- 3
Metrics Definition & Analytics Modeling
Every KPI gets one agreed definition, and we build the analytics data model that enforces it consistently across every dashboard and report.
- 4
Dashboard & Report Development
We build executive, operational, and self-service views on top of that model, so the numbers stay consistent no matter which dashboard someone opens.
- 5
Validation & Stakeholder Review
Business stakeholders check the numbers against what they already know before anything goes live, and we fix mismatches before adoption, not after.
- 6
Deployment, Adoption & Improvement
We track who's actually using each dashboard after launch and refine the ones that aren't earning adoption, rather than treating delivery as the finish line.
Data Analytics, BI & Decision Intelligence Use Cases
How our business analytics services show up across departments, from the boardroom to the warehouse floor.
Executive Performance Reporting
Leadership needs one consistent view of revenue, margin, and operating performance instead of a different number from each department.
Sales Pipeline & Revenue Analysis
Pipeline, conversion, and quota attainment tracked against a single pipeline definition so sales and finance read the forecast the same way.
Financial Performance Monitoring
Budget-to-actual, cash flow, and departmental spend tracked against agreed thresholds instead of a monthly spreadsheet reconciliation.
Operations & Productivity Dashboards
Operational analytics on throughput, utilization, and service levels, visible to operations leaders in time to adjust staffing or workflow, not after the shift ends.
Customer & Marketing Performance Analysis
Campaign performance, acquisition cost, and retention trends connected to the same customer definitions finance and sales already use.
Inventory & Supply Chain Visibility
Stock levels, turnover, and vendor performance visible across locations, so purchasing decisions aren't made on last week's export.
Cross-Department KPI Reporting
A shared KPI library that finance, operations, and product all report against, so a single company scorecard replaces five competing ones.
Scenario Analysis for Business Planning
Modeling how a pricing, staffing, or inventory change would move key metrics to support a decision rather than just describe the past.
Spreadsheet-Based Reporting vs. Centralized BI Dashboards
Spreadsheets aren't wrong for a small, one-off analysis. The gap shows up once multiple teams depend on the same numbers every week.
Technologies We Use for Data Analytics and BI
Technology choice depends on your existing data environment and reporting needs, not a fixed stack we apply to every client. These are the building blocks behind most analytics and reporting solutions we deliver, including data reporting and analytics work and, where a platform supports it, AI-powered business intelligence features such as natural-language querying.












Industries We Help With Data Analytics, BI & Decision Intelligence
Why Choose Wappnet AI for Data Analytics, BI & Decision Intelligence?
Choosing a Data Analytics, BI & Decision Intelligence Company is a long-term commitment, not a one-off dashboard project. A BI engagement that starts with dashboard design usually ends with a dashboard nobody opens a second time. Here's what you can expect working with us instead.
Business Questions Before Dashboards
We agree on the decisions a report needs to support before any chart gets built, so the dashboard answers a real question from day one.
Consistent Metric Definitions
Every KPI gets one definition enforced in the data model, not five versions scattered across departments and spreadsheets.
Platform-Agnostic Delivery
We work with the BI platform and warehouse you already run, connected to our broader data engineering practice, rather than pushing a migration you didn't ask for.
Validation and Adoption, Not Just Delivery
We check dashboards against what stakeholders already know before launch and track adoption afterward. A good dashboard improves the odds of a better decision; it doesn't replace good judgment.
Real-World Data Analytics, BI & Decision Intelligence Solutions We've Delivered
Unified Global Revenue & Pipeline Intelligence Platform
Consolidated disparate CRM and billing databases into a centralized Power BI semantic model, standardizing KPIs across 4 continents.
Automated Supply Chain & Inventory Replenishment Engine
Built interactive decision support dashboards with what-if scenario forecasting to optimize vendor ordering and safety stock levels.
Enterprise Governed Self-Service BI Rollout
Deployed Tableau and dbt semantic layers enabling 300+ non-technical business users to build self-service reports with zero metric drift.
Not Sure Why Your Dashboards Aren't Being Used?
Tell us what your teams are reporting on today, and where the numbers stop agreeing with each other. We'll give you an honest read on what a BI engagement would actually need to fix first.
Latest AI Insights & Industry Trends
 RAG
RAG vs Fine-Tuning vs Prompt Engineering: Which Approach Fits Your Use Case?
Compare RAG, fine-tuning, and prompt engineering to explore costs, use cases, and the best approach for enterprise AI.
 AI Copilot
What is an AI Copilot? Use Cases & Build Guide
What is an AI Copilot? Learn how it works, how it differs from AI agents, key use cases, and how to build one for your business.
 RAG
What Is RAG? A Complete Guide to Retrieval-Augmented Generation
Learn what RAG is, how Retrieval-Augmented Generation works, reduces AI hallucinations, and powers smarter enterprise AI.
Frequently Asked Questions
Data analytics services examine business data to identify trends, relationships, and performance patterns, so decisions are based on evidence rather than assumption.
Data analytics is the analysis itself, while business intelligence organizes that analysis into consistent reports, dashboards, and KPIs that the whole business reads the same way.
Decision intelligence connects a dashboard's data to the business context around a decision, including the options available and what happens after a choice is made, rather than presenting the number on its own.
BI dashboard development typically includes metric definition, an analytics data model, the dashboard build itself, and a validation step with stakeholders before launch. Full dashboard build-out depth lives on our Data Visualization Services page.
Standardizing KPIs starts with agreeing on one definition and calculation method per metric, then enforcing that definition in a shared analytics data model so every dashboard pulls from the same source.
Common options include Microsoft Power BI, Tableau, Looker, Qlik, and Amazon QuickSight. The right choice depends on your existing data platform, user licensing, and reporting needs, not a single tool that fits every business.
Yes. BI dashboards are typically connected to the databases, warehouses, CRMs, and ERPs you already run, rather than requiring a new platform before reporting can start.
Self-service BI gives business users governed access to explore a curated data model on their own, within guardrails that keep metric definitions and data security consistent across the organization.
Reporting describes what happened using agreed metrics, while analytics digs into why it happened and what patterns explain it, often using the same underlying data model.
Some operational use cases benefit from near real-time dashboards, though most BI reporting runs on scheduled refreshes. Streaming analytics on live event data is covered in depth on our Real-Time Data Analytics page.
Predictive analytics forecasts a future value from historical data, while decision intelligence takes that output, or a descriptive dashboard metric, and connects it to the business context and options around an actual decision.
Value usually shows up as faster access to trusted numbers, fewer hours spent reconciling conflicting reports, and higher adoption of dashboards that previously went unused, not from the dashboard alone but from the decisions it supports.